Leaderboard
The leaderboard compares model performance on the AIICE evaluation dataset across multiple metrics and sea regions. You can explore model configurations in examples.
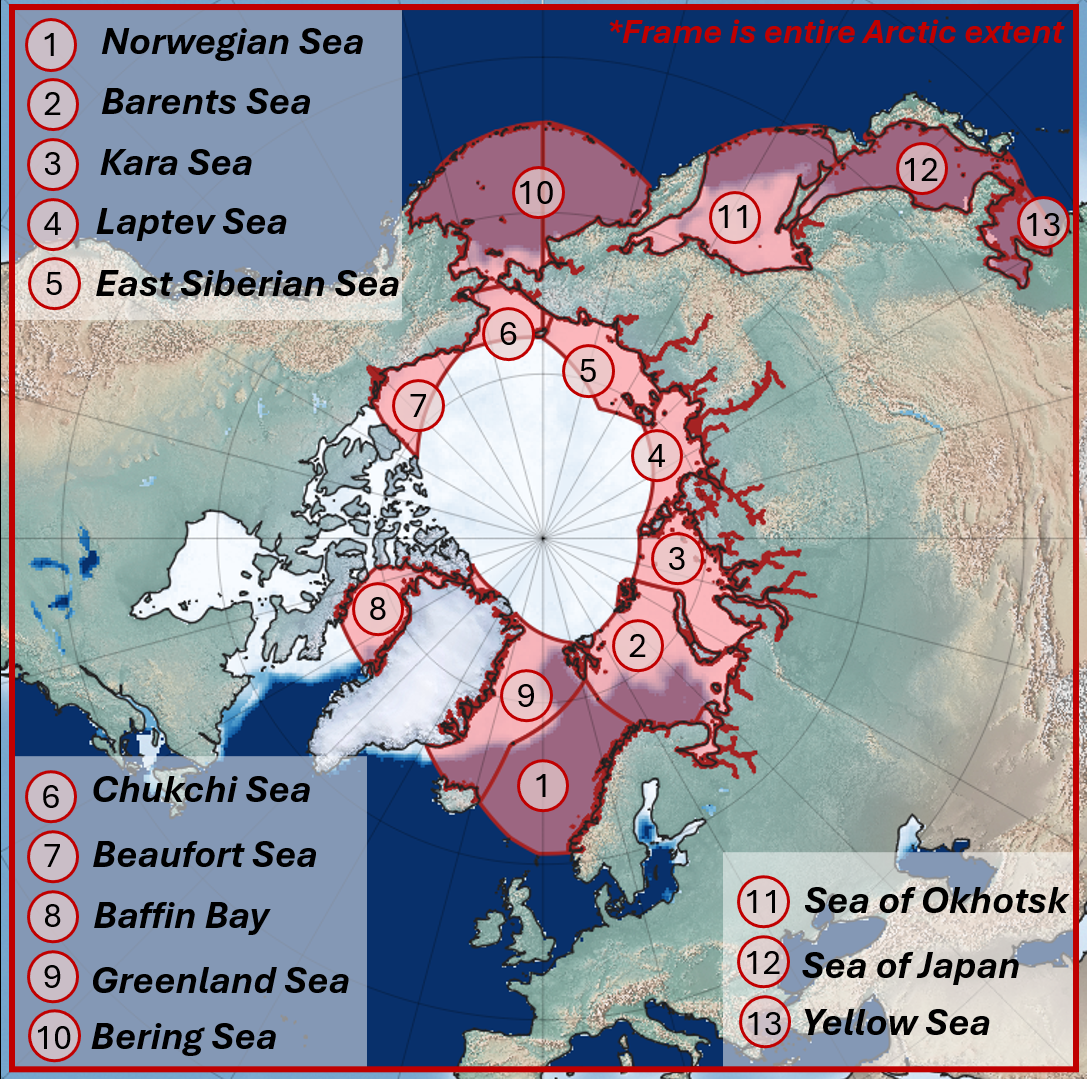
The full benchmark covers the entire Arctic Ocean basin shown below. For the leaderboard we selected 5 seas that we find most dynamically interesting — regions with pronounced seasonal variability and complex ice dynamics: Barents Sea, Kara Sea, Laptev Sea, Chukchi Sea, and Sea of Japan.
How to read the results
- Overview — averaged scores across all forecast lengths and steps; shows the best-performing model per metric in each sea region.
- Radar chart — normalized per metric; closer to the edge means better. Hover over a point to see the raw value.
- Tables — models ranked best → worst for the selected configuration. Bar lengths are min–max normalized: the best model always gets a full bar.
All metric definitions and formulas are on the Metrics reference page.
Note
To add your model to the leaderboard, follow the leaderboard instruction and the Contributing guide.